The analysis of ProShares Ultra QQQ (QLD) across four key periods (5 days, 1 month, 6 months, 1 year) reveals consistent upward price movement accompanied by marked volatility typical for a 2x leveraged Nasdaq-100 ETF.
| Period | Start | End | Change | High | Low | Volatility |
|---|---|---|---|---|---|---|
| 5d | 143.980 | 151.429 | +5.17% | 152.770 | 143.980 | 6.161 |
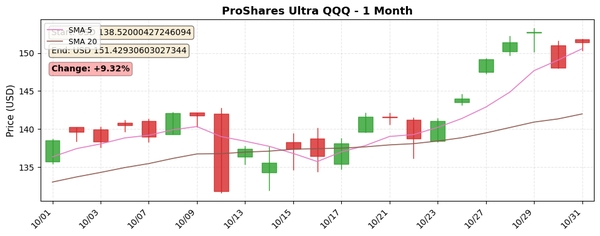
| 1mo | 138.520 | 151.429 | +9.32% | 152.770 | 131.810 | 11.799 |
| 6mo | 93.409 | 151.429 | +62.11% | 152.770 | 90.613 | 20.404 |
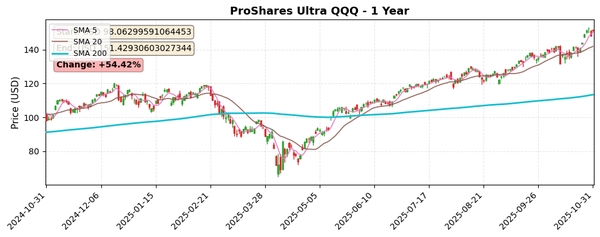
| 1y | 98.063 | 151.429 | +54.42% | 152.770 | 69.243 | 46.824 |
The technical indicator analysis shows the short-term (SMA 5 at 150.556) and medium-term (SMA 20 at 141.994) moving averages are well above the long-term SMA 200 at 113.388, indicating a strong bullish trend that is supported across time frames. This overall SMA structure reinforces positive momentum and buying pressure.
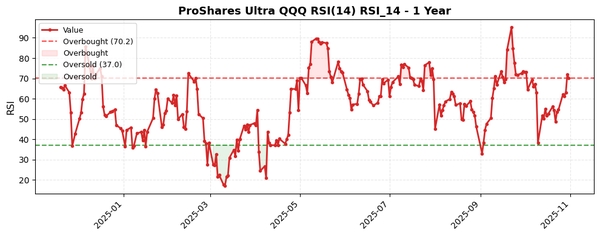
The Relative Strength Index (RSI) for the 1-year period is currently at 70.05, very close to the typical overbought threshold of 70.2, signaling that the ETF may be nearing a short-term peak or correction phase. Investors should watch this level closely for potential pullback or confirmation of continued strength.
Given the ETF's leveraged nature, volatility levels are high, with 1-year volatility at 46.824 reflecting substantial price swings which present both risk and reward opportunities for traders and investors.
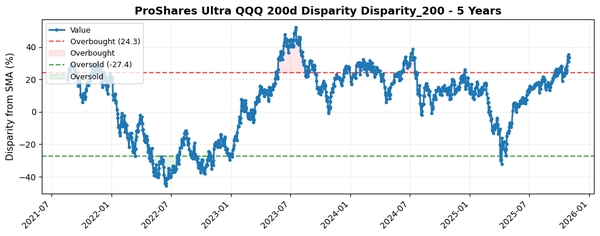
Chart visualizations accompany this analysis for clearer trend recognition and pattern validation:
https://pub-8ab005469c4042798a7550efc290ac49.r2.dev/charts/ProShares_Ultra_QQQ_1mo_chart_1761924204.jpg
https://pub-8ab005469c4042798a7550efc290ac49.r2.dev/charts/ProShares_Ultra_QQQ_1y_chart_1761924204.jpg
https://pub-8ab005469c4042798a7550efc290ac49.r2.dev/charts/ProShares_Ultra_QQQ_200d_Disparity_Disparity_200_5y_chart_1761924204.jpg
https://pub-8ab005469c4042798a7550efc290ac49.r2.dev/charts/ProShares_Ultra_QQQ_RSI14_RSI_14_1y_chart_1761924204.jpg
In conclusion, ProShares Ultra QQQ is demonstrating high growth and momentum, supported by strong technical indicators. Investors should monitor RSI levels for possible overbought conditions and remain mindful of volatility when considering entry or exit points.