The analysis of iShares Gold Trust (IAU) across multiple periods reveals varied price momentum and volatility characteristics:
| Period | Start | End | Change | High | Low | Volatility |
|---|---|---|---|---|---|---|
| 5d | 77.310 | 75.650 | -2.15% | 77.310 | 74.310 | 4.174 |
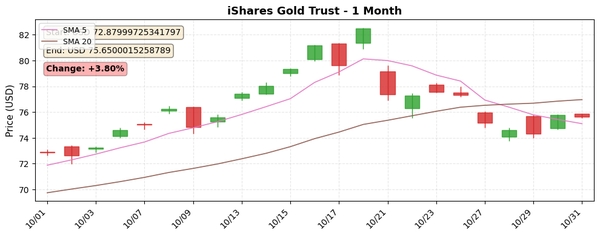
| 1mo | 72.880 | 75.650 | +3.80% | 82.500 | 72.650 | 10.102 |
| 6mo | 60.970 | 75.650 | +24.08% | 82.500 | 59.970 | 14.813 |
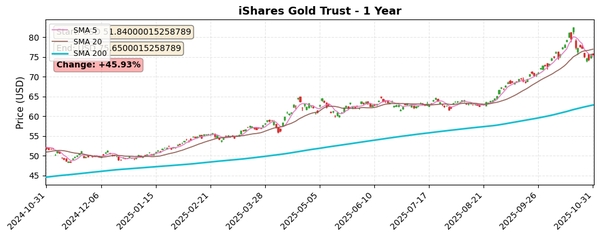
| 1y | 51.840 | 75.650 | +45.93% | 82.500 | 48.370 | 19.675 |
Price movements:
Key Technical Insights:
Volatility:
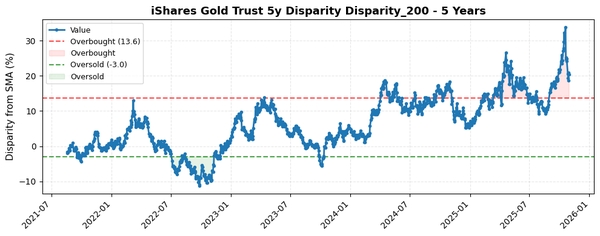
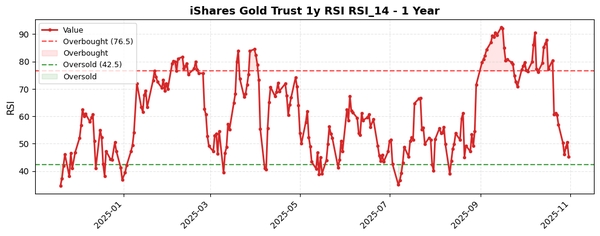
Charts for visual inspection:
https://pub-8ab005469c4042798a7550efc290ac49.r2.dev/charts/iShares_Gold_Trust_1mo_chart_1761924203.jpg
https://pub-8ab005469c4042798a7550efc290ac49.r2.dev/charts/iShares_Gold_Trust_1y_chart_1761924203.jpg
https://pub-8ab005469c4042798a7550efc290ac49.r2.dev/charts/iShares_Gold_Trust_5y_Disparity_Disparity_200_5y_chart_1761924203.jpg
https://pub-8ab005469c4042798a7550efc290ac49.r2.dev/charts/iShares_Gold_Trust_1y_RSI_RSI_14_1y_chart_1761924203.jpg