- Key Patterns and Trends:
- The 10-Year Treasury Yield (^TNX) shows a moderate year-long decrease of 4.51%, indicative of easing liquidity and lower sovereign borrowing costs, though short-term (5-day) increases reflect episodic tightening.
- NFCI metrics consistently remain below zero, with significant easing over the past two years (-0.296 to -0.549), signaling broadly loose financial conditions and easier credit availability.
- The US Dollar Index (DX=F) weakened by 4.16% over the past year but rebounded 2.24% in the last month, showing a complex dynamic with short-term dollar strength amid longer-term depreciation.
- Correlations Between Analyses:
- The declining Treasury yields correlate with the NFCI's move to more negative values, jointly reflecting looser monetary and financial conditions conducive to risk taking.
- Elevated volatilities, particularly over 1-year and 2-year horizons, correspond across indicators, underscoring market uncertainty influencing both interest rates and currency markets.
- The short-term uptick in yields and US Dollar Index suggests temporary liquidity tightening or risk reappraisals potentially related to geopolitical or economic news flow.
- Strategic Insights:
- The convergence of lower Treasury yields and loosening NFCI indicates a favorable environment for risk assets such as equities and credit, as borrowing costs remain contained and financial stress is reduced.
- Investors should monitor Treasury yield resistance near the 200-day SMA (4.303) and the US Dollar Index's position below its 200-day SMA (~100 level), as these technical levels may signal shifts in liquidity or risk sentiment.
- The high volatility in currency and yield markets demands tactical agility, highlighting the need for diversified hedging approaches in fixed income and currency exposures.
- Policymakers should note the NFCI's sustained easing as a sign that credit conditions are accommodative, potentially limiting the need for aggressive tightening absent inflationary pressures.
- Charts and Tables (As Provided):
10-Year Treasury Yield (^TNX) Metrics Table:
| Period |
Start |
End |
Change |
High |
Low |
Volatility |
| 5d |
3.997 |
4.091 |
+2.35% |
4.093 |
3.983 |
2.229 |
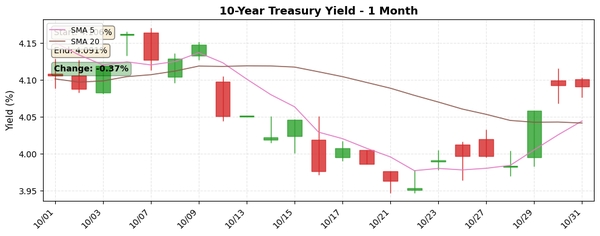
| 1mo |
4.106 |
4.091 |
-0.37% |
4.162 |
3.953 |
4.531 |
| 6mo |
4.322 |
4.091 |
-5.34% |
4.596 |
3.953 |
11.889 |
| 1y |
4.284 |
4.091 |
-4.51% |
4.803 |
3.953 |
19.722 |
- SMA(5): 4.044, SMA(20): 4.042, SMA(200): 4.303
Charts:
https://pub-8ab005469c4042798a7550efc290ac49.r2.dev/charts/10_Year_Treasury_Yield_1mo_chart_1761924200.jpg