Here is a detailed trend analysis of Global X Copper Miners ETF (COPX) for selected periods:
| Period | Start | End | Change | High | Low | Volatility |
|---|---|---|---|---|---|---|
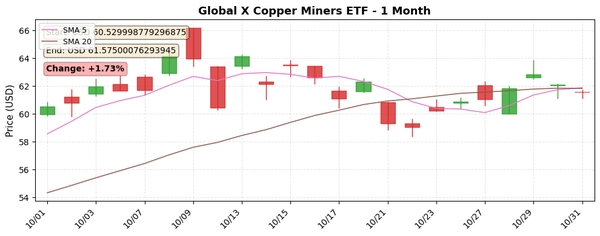
| 5d | 60.860 | 61.575 | +1.17% | 62.840 | 60.860 | 3.064 |
| 1mo | 60.530 | 61.575 | +1.73% | 64.140 | 59.040 | 12.722 |
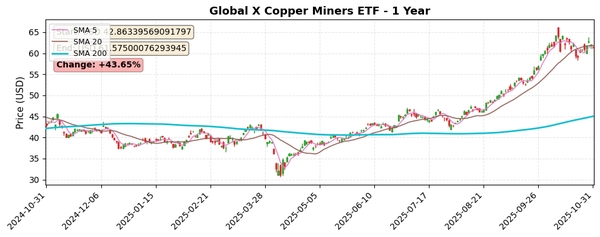
| 6mo | 38.667 | 61.575 | +59.25% | 64.140 | 38.309 | 19.860 |
| 1y | 42.863 | 61.575 | +43.65% | 64.140 | 31.069 | 35.484 |
Key Technical Insights:
Chart Links for Visual Reference:
https://pub-8ab005469c4042798a7550efc290ac49.r2.dev/charts/Global_X_Copper_Miners_ETF_1mo_chart_1761924206.jpg
https://pub-8ab005469c4042798a7550efc290ac49.r2.dev/charts/Global_X_Copper_Miners_ETF_1y_chart_1761924206.jpg
https://pub-8ab005469c4042798a7550efc290ac49.r2.dev/charts/Global_X_Copper_Miners_ETF_RSI_14_1y_chart_1761924206.jpg
https://pub-8ab005469c4042798a7550efc290ac49.r2.dev/charts/Global_X_Copper_Miners_ETF_Disparity_200_5y_chart_1761924206.jpg
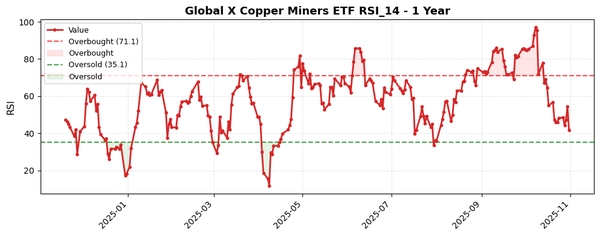
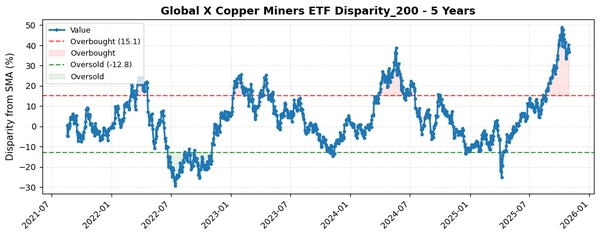
Overall, the Global X Copper Miners ETF shows strong long-term bullish behavior with moderate short-term gains and balanced momentum as per technical indicators. This supports a positive outlook for investors considering exposure to the copper mining sector, but monitoring for volatility spikes and RSI movements is recommended for timing entries and exits effectively.