| Period | Start | End | Change | High | Low | Volatility |
|---|---|---|---|---|---|---|
| 5d | 523.610 | 521.620 | -0.38% | 542.070 | 521.620 | 4.796 |
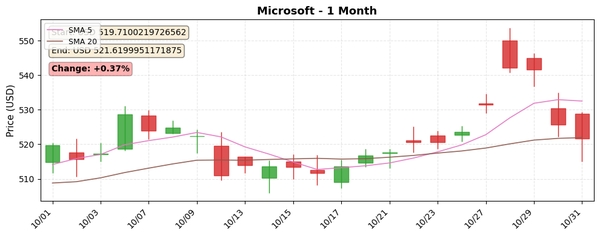
| 1mo | 519.710 | 521.620 | +0.37% | 542.070 | 510.960 | 5.562 |
| 6mo | 433.769 | 521.620 | +20.25% | 542.070 | 431.806 | 11.153 |
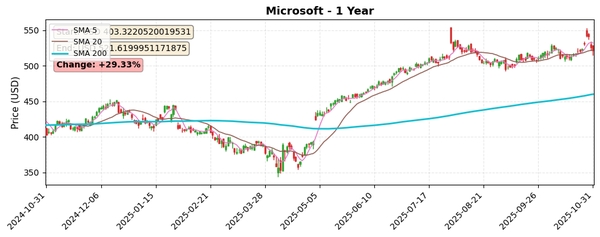
| 1y | 403.322 | 521.620 | +29.33% | 542.070 | 353.329 | 24.125 |
Additional Technical Indicators:
Chart Links:
https://pub-8ab005469c4042798a7550efc290ac49.r2.dev/charts/Microsoft_1mo_chart_1761924205.jpg
https://pub-8ab005469c4042798a7550efc290ac49.r2.dev/charts/Microsoft_1y_chart_1761924205.jpg
https://pub-8ab005469c4042798a7550efc290ac49.r2.dev/charts/Microsoft_Disparity_200_5y_chart_1761924205.jpg
https://pub-8ab005469c4042798a7550efc290ac49.r2.dev/charts/Microsoft_RSI_14_1y_chart_1761924206.jpg
Comprehensive Insights:
Microsoft's stock has shown a strong bullish trend over the last year, supported by significant gains and sustained momentum. The stock trades comfortably above its long-term SMA(200), reflective of investor confidence and positive market sentiment. Short-term price changes over the 5-day and 1-month periods suggest some consolidation or sideways movement, indicating a pause or mild uncertainty near current price levels. Volatility remains moderate, suggesting manageable risk.
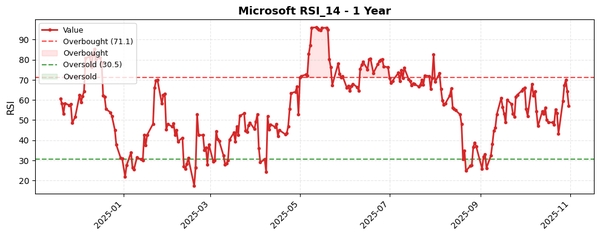
The RSI reading of 57.09, safely within neutral bounds, shows no immediate overbought or oversold conditions, supporting the case for steady holding or accumulation opportunities rather than impulsive selling or buying.
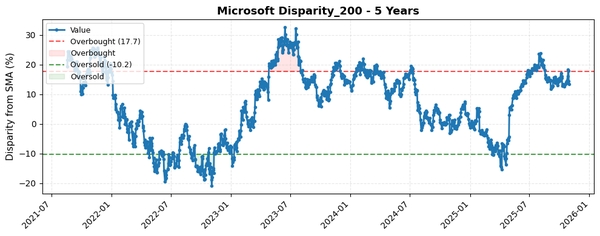
Investors should monitor the 1-month chart closely for breakout signs from the current consolidation and watch volume patterns for confirmation. The 5-year disparity chart further contextualizes current price deviations from the 200-day moving average, suggesting healthy price fundamentals.
Overall, the technical outlook favors continued strength with caution for short-term fluctuations. Long-term investors may see this as a stable buy or hold, while traders might await clearer trend signals for entry or exit.