Here is the detailed trend analysis for NVIDIA (NVDA) across selected periods:
| Period | Start | End | Change | High | Low | Volatility |
|---|---|---|---|---|---|---|
| 5d | 186.260 | 205.409 | +10.28% | 207.040 | 186.260 | 6.380 |
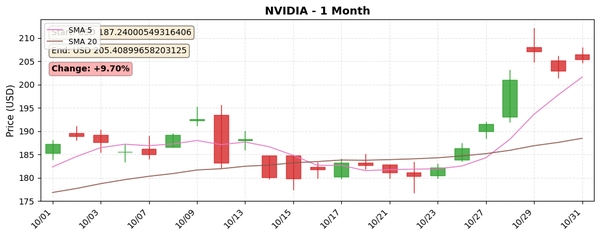
| 1mo | 187.240 | 205.409 | +9.70% | 207.040 | 179.830 | 11.158 |
| 6mo | 114.486 | 205.409 | +79.42% | 207.040 | 113.526 | 22.001 |
| 1y | 132.722 | 205.409 | +54.77% | 207.040 | 94.298 | 49.352 |
The 1-month and 1-year OHLCV charts are available for visual inspection of price trends.
Moving Averages (as of latest data):
This confirms a strong upward trend with short-term moving averages well above the long-term average.
RSI Analysis (14-day window for 1-year period):
Disparity Chart (200-day window over 5 years) indicates dynamic deviations from the long-term SMA, highlighting typical bullish phases.
Key Insights:
Chart links:
https://pub-8ab005469c4042798a7550efc290ac49.r2.dev/charts/NVIDIA_1mo_chart_1761924204.jpg